Research Edition Interview scheduling benchmarks: time to schedule, reschedule rate and panel size by industry
Contents
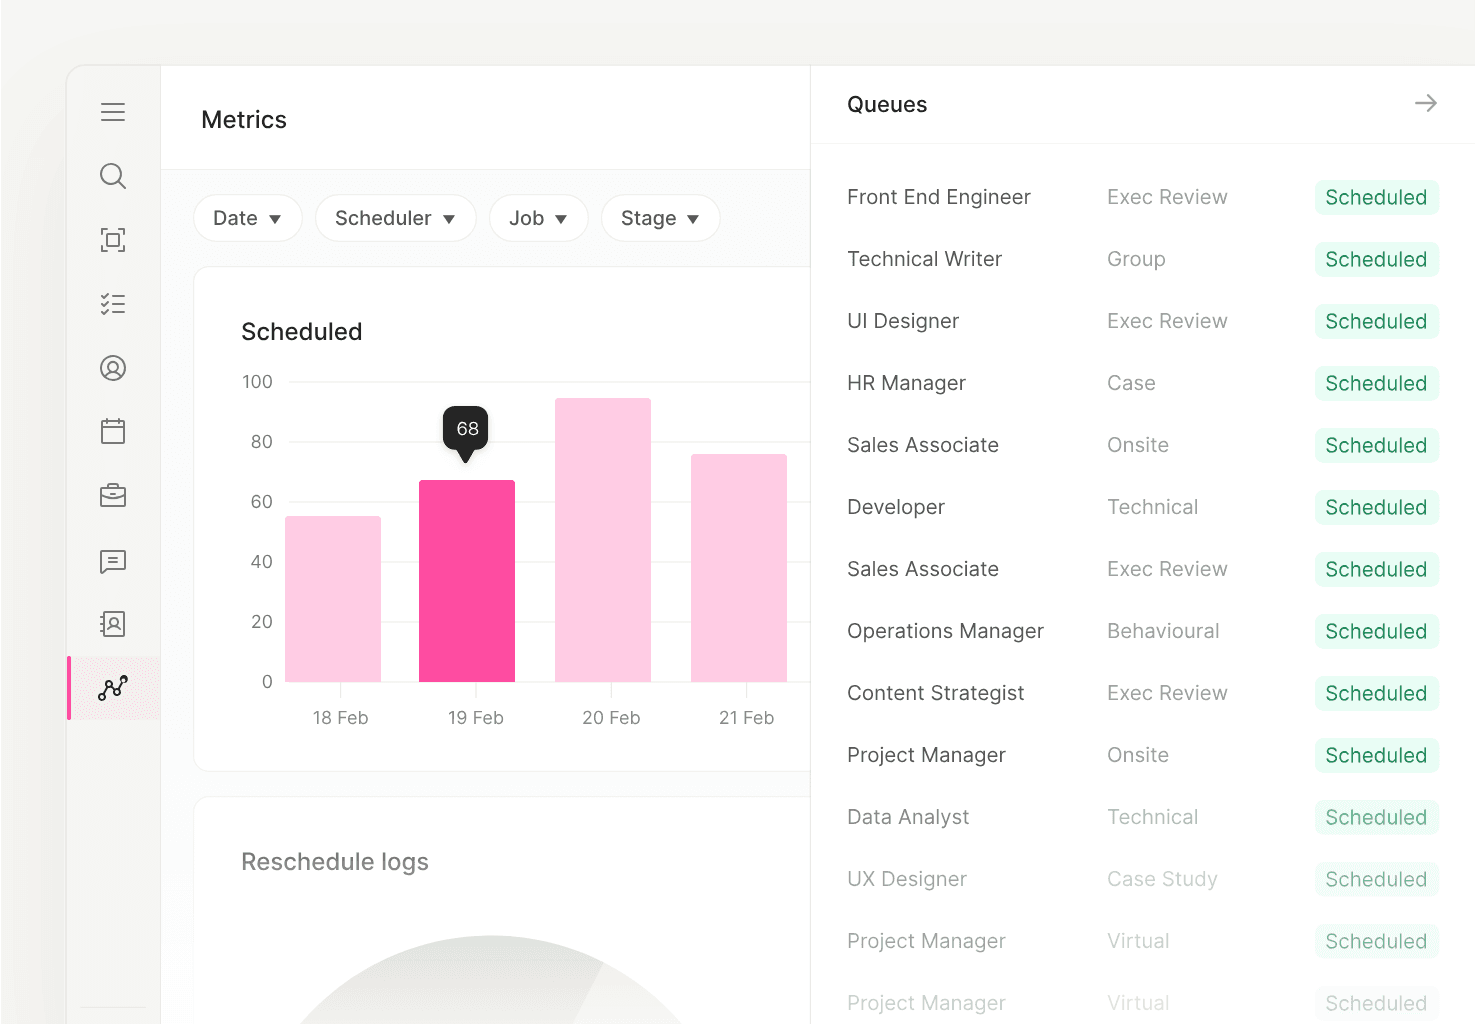
ModernLoop Reporting & Dashboards, shown with sample data. The figures in this report are below.
of confirmed interviews rescheduled at least once
interviewers in the median onsite or virtual onsite loop
interviews per active interviewer per week
Methodology
The data
Each record describes one interview: when it was requested, when it was confirmed, whether it moved, who was on it and what type of interview it was. Only interviews scheduled through ModernLoop are included, so the sample reflects teams that use dedicated interview scheduling software.
How the data was anonymized and aggregated
Candidate, interviewer and company names, email addresses and free-text fields were removed before analysis.We report medians rather than averages, because a few very slow or very fast interviews would otherwise skew the picture.
Exclusions
- Test, demo and internal interviews.
- Requests canceled before any time was confirmed (reported separately, not in time to schedule).
- Records with missing or inconsistent timestamps.
Industries
An industry appears in a table only when it meets the minimum segment size above; everything else is still counted in “All industries”.
Definitions
Every figure in this report uses the definitions below. Use the same ones when you compare your own numbers.
| Metric | Definition | How it’s measured |
|---|---|---|
| Reschedule rate | Share of confirmed interviews moved to a new time at least once before they took place. | Rescheduled interviews ÷ confirmed interviews, split by who asked for the change: candidate, interviewer or company. Cancellations with no new time are reported separately. |
| Panel size | Number of interviewers who assess the candidate, per panel session and per loop. | Median interviewers per panel session (two or more interviewers together) and per loop (all interviews for one candidate in one stage). Trainees in shadow seats are counted separately. |
| Interviewer load | How many interviews each interviewer runs. | Interviews per active interviewer per week (active means at least one interview that week). Median, plus the share of all interviews run by the busiest 10% of interviewers. |
Time to schedule by industry
Definition: the time from an interview request, or the ATS stage change that triggers it, to a confirmed interview on the calendar.
Chart: median time to schedule by industry, split by interview type (recruiter screens, single interviews, onsite loops)
Industries with too few companies to report are counted in “All industries”.
What it means
Time to schedule is the part of time to hire that recruiting operations controls most directly. When it runs long, the wait usually sits in one of three places: the request waiting for someone to pick it up, the candidate waiting for times that work, or the team waiting on interviewers whose calendars aren’t current. Loops take longer than screens because every interviewer has to be free in the same block. If you’re well above your industry’s median, measure those three waits separately before you change anything.
Reschedule rate by industry
Definition: the share of confirmed interviews moved to a new time at least once before they took place.
Chart: reschedule rate by industry, stacked by who asked for the change (candidate, interviewer, company)
| Industry | Reschedule rate | Asked by the candidate | Asked by an interviewer or the company | Cancellation rate |
|---|---|---|---|---|
| Technology | [X%] | [X%] | [X%] | [X%] |
| Financial services | [X%] | [X%] | [X%] | [X%] |
| Healthcare | [X%] | [X%] | [X%] | [X%] |
| Life sciences | [X%] | [X%] | [X%] | [X%] |
| Professional services | [X%] | [X%] | [X%] | [X%] |
| Retail and hospitality | [X%] | [X%] | [X%] | [X%] |
| Manufacturing and logistics | [X%] | [X%] | [X%] | [X%] |
| All industries | [X%] | [X%] | [X%] | [X%] |
What it means
Some rescheduling is healthy: it means candidates feel free to ask. The share started by interviewers is the part your team controls, and it usually points to calendars that don’t reflect real availability or to a small pool of interviewers carrying too many loops. Track the two sources separately, and treat a rising interviewer share as an early warning.
Panel size by industry
Definition: the number of interviewers who assess a candidate in one panel session, and across a full loop.
Chart: median interviewers per loop by industry, with the share of loops that include a trainee
| Industry | Interviewers per panel session | Interviewers per loop | Interviews per loop | Loops with a trainee |
|---|---|---|---|---|
| Technology | [X] | [X] | [X] | [X%] |
| Financial services | [X] | [X] | [X] | [X%] |
| Healthcare | [X] | [X] | [X] | [X%] |
| Life sciences | [X] | [X] | [X] | [X%] |
| Professional services | [X] | [X] | [X] | [X%] |
| Retail and hospitality | [X] | [X] | [X] | [X%] |
| Manufacturing and logistics | [X] | [X] | [X] | [X%] |
| All industries | [X] | [X] | [X] | [X%] |
What it means
Bigger loops aren’t better loops. Each extra interviewer adds a calendar to coordinate and another voice in the debrief, so every seat should test something no one else does. Compare your loop size with your industry, then check that each interview maps to a distinct competency, as described in how to design an interview loop. The share of loops with a trainee shows whether your interviewer pool is growing or just getting busier.
Interviewer load by industry
Definition: how many interviews each active interviewer runs in a week.
Chart: interviews per interviewer per week by industry, median against the busiest 10% of interviewers
| Industry | Interviews per interviewer per week (median) | Busiest 10% of interviewers (per week) | Share of interviews run by the busiest 10% |
|---|---|---|---|
| Technology | [X] | [X] | [X%] |
| Financial services | [X] | [X] | [X%] |
| Healthcare | [X] | [X] | [X%] |
| Life sciences | [X] | [X] | [X%] |
| Professional services | [X] | [X] | [X%] |
| Retail and hospitality | [X] | [X] | [X%] |
| Manufacturing and logistics | [X] | [X] | [X%] |
| All industries | [X] | [X] | [X%] |
What it means
Load is rarely spread evenly. Trusted interviewers get asked first, so the share carried by the busiest few is the number to watch, not the median. If that share is high, widen the pool by training new interviewers through shadows and reverse shadows, and set a weekly limit per interviewer so new interviews go to whoever has room.
Time to hire, for context
Time to hire runs from when a candidate enters your process to when they accept an offer. There’s no single average time to hire worth quoting: it swings with role, seniority, industry and when each company starts the clock. What this report adds is the scheduling share of it.[X]
How to benchmark your own team
Six steps to compare your numbers with this report. The recruiting metrics guide covers each metric in more depth.


Public data, not ModernLoop data
Hiring volume by industry
For scale: how many people U.S. employers hired in August 2026, and how many jobs were open, by industry. These figures count every hire, including hourly roles that rarely need a multi-interview loop, so they show where hiring volume is, not where scheduling is hardest.
| Industry | Hires in August | Job openings |
|---|---|---|
| Professional and business services | 935 | 1,186 |
| Accommodation and food services | 750 | 713 |
| Health care and social assistance | 703 | 1,359 |
| Retail trade | 667 | 761 |
| Manufacturing | 332 | 522 |
| Educational services (private) + state and local education | 266 | 353 |
| Transportation, warehousing and utilities | 247 | 338 |
| Finance and insurance | 110 | 353 |
| Information (technology) | 44 | 123 |
Source: U.S. Bureau of Labor Statistics, Job Openings and Labor Turnover Survey, August 2026 (preliminary).
How to cite this report
When you quote a figure, cite the edition and link to this page, so readers can check the definitions behind the number.
Suggested citation
Include the edition: figures change between editions
ModernLoop.modernloop.com/research/interview-scheduling-benchmarks/
